Excel Tip: F11 Quick Chart

Highlighting any set of figures in MS Excel and clicking F11 will give you more insight about your data.
For example if you enter your data as shown below:
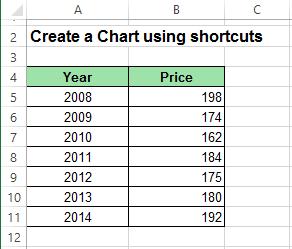
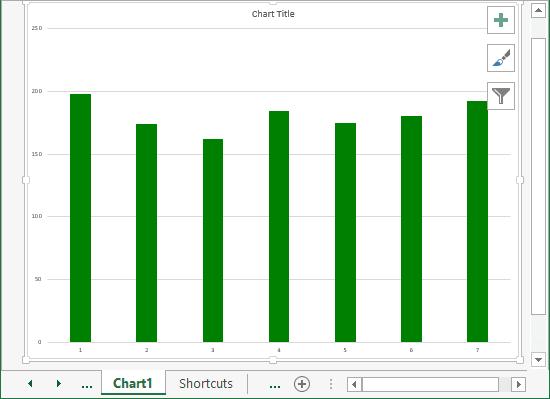
Then highlight the data range and press F11, this will chart the data you have selected and insert it in new worksheets, allowing you to clearly see the pattern of your data as shown below:
In case you may want to delete the chart, the sequence for doing that is Alt, H, D, and S to delete the sheet. Either way, you are going to get a warning before you delete. Make sure you are staring at the chart when you delete the sheet, and hit Enter. Charting, obviously, is great for spotting trends in the data. When you hit your F11 quick chart, you want to be particular on the lookout for discontinuities in the data and you will be looking for commercial explanations for those discontinuities.
Chart Patterns
Usually there are 3 main kinds of discontinuities when you do your F11 quick chart.
- Spikes’ in the data
- Changes in slope
- Sudden ‘step up’ or ‘step down’
Make sure you have commercial explanations for those discontinuities. This tip is mainly on one shortcut key.